Student Supplement (DL 125)

-
Analyzing Social Media Data
- DIGITAL LITERACY PROFILE
- Pre-Course Digital Literacy Profile
- LESSON ONE: USING A COMPUTER
- Getting Started
- Quick Poll - Computer Use Confidence
- Knowledge Check 1A
- Global Positioning System (GPS)
- Purchasing a Computer
- Name This Disc
- Activity #2 - Page 14
- Marriott Teleports Couples to Hawaii and London
- Windows Start Menu
- Using a Mouse
- Using a Keyboard
- How to Take a Screenshot
- Selecting a Printer - Author Insights
- Printer Comparison Worksheet
- 3D Printing - Author Insights
- 3D Printing
- Lesson One Key Terms - Crossword Puzzle
- Lesson One Crossword Puzzle Upload
- Knowledge Check 1B
- LESSON TWO: THE DESKTOP
- The Desktop Overview
- Desktop Image
- Knowledge Check 2A
- Desktop Icons Assignment
- Lesson Two Key Terms - Crossword Puzzle
- Lesson Two Crossword Puzzle Upload
- LESSON THREE: SOFTWARE
- Software Introduction
- Knowledge Check 3A
- The Operating System - Author Insights
- Amazon Echo Dot vs. Google Nest Mini
- Poll: Amazon Echo Dot vs. Google Nest Mini
- Opening Google Docs
- Creating a Google Doc
- Using the Google Docs Toolbar
- Editing a Google Doc
- Sharing a Google Doc
- Knowledge Check - Google Docs
- Word Processing
- Knowledge Check - Word Processing
- Using Templates - COVID-19 Flyer
- The R.E.E.L. - Page 43
- Sample Resume and Template
- Spreadsheets
- Knowledge Check - Spreadsheets Review
- Activity #3 - Page 47
- Knowledge Check - Candy Café
- Davis Foods Spreadsheet
- Davis Foods Scatter Chart
- Davis Foods Excel Demo
- Knowledge Check - Davis Foods Demo
- How to Use PowerPoint
- Practice Presentation
- Customize a Presentation
- Knowledge Check - Using PowerPoint
- Antivirus Software and Colonial Pipeline Hack
- Knowledge Check - Lesson Three Key Terms
- LESSON FOUR: USING THE INTERNET
- Overview of Using the Internet
- What is the Internet?
- The First Web Page
- Knowledge Check 4A
- Everyday Tasks Made Easy - Searching the Web
- How to Clear Your Browser Cache (Chrome)
- How to Clear Your Browser Cache (Firefox)
- Everyday Tasks Made Easy – Shopping
- Knowledge Check 4B
- Everyday Tasks Made Easy – Banking
- Activity #2 - Page 62
- How to Read Your Utility Bill
- The R.E.E.L. - Page 64
- The R.E.E.L. - Page 64 (Answers)
- Depositing Checks Remotely
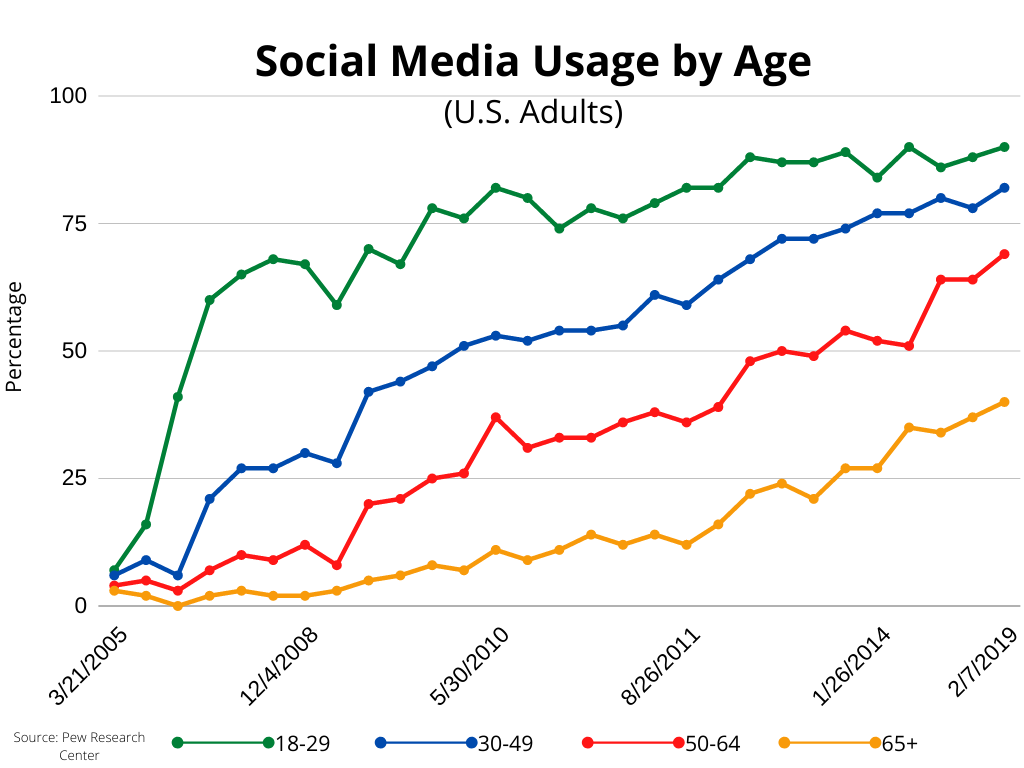
- Everyday Tasks Made Easy – Using Social Media
- Analyzing Social Media Data
- Analyzing Social Media Data - Answers
- Knowledge Check 4C – Analyzing Social Media Data
- Knowledge Check 4C
- Lesson Four Key Terms - Crossword Puzzle
- Lesson Four Crossword Puzzle Upload
- LESSON FIVE: Using E-mail
- Overview of Using E-mail
- What is E-mail?
- Knowledge Check 5A - Domain Name Extensions
- Sending and Receiving E-mail
- Tips for Writing Effective E-mails
- Knowledge Check 5B
- How to Send an Attachment
- E-mail Folders
- Knowledge Check - Lesson Five Key Terms
- LESSON SIX: Online Safety & Privacy
- Overview of Online Safety & Privacy
- My Digital Behavior Score
- Digital Behavior Score Key
- Hackers, Malware, & the Black Market
- Knowledge Check 6A
- Overcoming a Data Breach
- Strong Passwords
- Suspicious E-mails and Activity #3
- A True Main Street Story: Susan and Ransomware
- A True Main Street Story: Susan and Ransomware Rec...
- Knowledge Check 6B
- Cookies and Activity #4
- Spotting Fake News
- Fake News Jeopardy
- Lesson Six Key Terms - Cyber Rhymes
- Lesson Seven: Real-World Applications
- Overview of Real-World Applications
- The Holland Codes
- Job Search
- Articulating a Positive Self-Image
- Building Self-Confidence
- Job Search Process
- ThirdEd Spotlight - Kelly Babb Shares Job Search I...
- Writing a Cover Letter
- Sample Cover Letter
- ThirdEd Spotlight - Resume Advice from Scott Vedde...
- Crafting a Great Resume
- The Job Application
- Types of Interviews
- Sample Interview Questions
- Illegal Interview Questions
- Knowledge Check - Illegal Interview Questions
- The Felony Conviction Question
- Knowledge Check - Interviewing
- Creating a Professional Profile
- How to Prepare for a Job Interview
- Knowledge Check - Job Search Process
- Being Successful on the Job
- Taking Courses Online
- Navigating Your Online Course
- Information Literacy - Part 1
- Information Literacy - Part 2
- Online Search Tips - Personal Health
- Knowledge Check - Information Literacy
- Lesson Seven Key Terms - RIASEC Review
- Post-Course Digital Literacy Profile
- Post-Course Digital Literacy Survey
- Course info